Mesa OS 4x12 Impedance Curve vs Load Boxes

  • Thread starter Thread starter easstudios
  • Start date Start date
easstudios

easstudios

Well-known member
Bit of a nerdy test. Apologies that its so dull!

Compared how the power amp of my 2 channel Dual Rectifier (early Rev G) responds with different loads. In each graph, it shows the frequency graph of a Mesa OS 4x12 with 8 Ohm V30's compared to various load boxes. I suspect this will vary with different power amps and different cabs quite a lot (ill try and compare those a little later). This is one of those things where there are a lot of variables interacting with each other, so there really is no "single best" option - I'd really recommend trying as many as you can with your own set up and deciding what you like from there. I love all 3 loads I tested here and they get pretty equal amounts of use.

I used the Rectifier, because the red channel has no NFB which means the cab/load will have a bigger impact. I've often found Rectifiers can sound quite dull with some loads, especially compared to the response you get in the room with a Mesa cab. It also explains why those motherfuckers are fussy with which cab you use. I've always liked the Suhr with the Rectifier, and since picking up the Fryette, warm and edge was my favourite sounding curve. Nice to have some visual validation of what I was hearing

SUHR RL.png
REACT IR.png
FRYETTE DEEP BRITE.png
FRYETTE DEEP EDGE.png
FRYETTE WARM BRITE.png
FRYETTE WARM EDGE.png
 
Very nice. I built a reactive load with high end audio crossover parts a couple years ago, same general circuit as the Suhr, but I used different values so that it approximated my cab’s impedence curve when I measured it. My recto in modern mode sounds dead-nuts the same with that load and reamped with a flat solidstate power amp, as it does direct into the cab. Advantage of load+reamp being that now I can run it a bit hotter into the load, and use post FX without having to turn on the shitty loop.

When I did some testing a while back I was surprised how some amps are so much less sensative to the load used. I have a switch on my load box to short the reactive element so it becomes a purely resistive load. The recto hates it. But my jet city jca50 sounds almost the same in either mode (as long as I haven’t dialed presence or resonance high).
 
It basically shows how much a poweramp changes its voicing based on what cabinet (or load) its connected to. Just explains a bit why some cabs pair up nicely with certain amps.

Very nice. I built a reactive load with high end audio crossover parts a couple years ago, same general circuit as the Suhr, but I used different values so that it approximated my cab’s impedence curve when I measured it. My recto in modern mode sounds dead-nuts the same with that load and reamped with a flat solidstate power amp, as it does direct into the cab. Advantage of load+reamp being that now I can run it a bit hotter into the load, and use post FX without having to turn on the shitty loop.

When I did some testing a while back I was surprised how some amps are so much less sensative to the load used. I have a switch on my load box to short the reactive element so it becomes a purely resistive load. The recto hates it. But my jet city jca50 sounds almost the same in either mode (as long as I haven’t dialed presence or resonance high).

That's awesome! I'd love a load box based on a Mesa so my Rectifier responds the same. The Suhr does a reasonable job but that amp is particularly fussy. Pretty sure it depends on how much NFB the amp uses, cant remember off hand what JCA/Soldano's use (guessing maybe 4 ohm like a late 70's/80's Marshall?

I did some tests using the Friedman too (with the Mesa cab and also a 1960TV with Greenbacks. Surprisingly similar results actually!
 
How do you measure a reactive loads impede ve curve?

I'm actually measuring the response of the power amp with different impedance loads connected, rather than the actual impedance curve. I used the Rectifier as it has no NFB on the red channel, so the curve it produces is much more influenced by the load than an amp with lots of damping.

There's a guide here to do it properly but I dont have the gear (to risk breaking) or will power to go this deep. Would be an awesome way of measuring cabs, to then plug values in to approximate with a circuit.

https://www.roomeqwizard.com/help/help_en-GB/html/impedancemeasurement.html
 
How complicated would it be to make a load box with a switchable impedance curve? Say switchable between something approximating a Marshal 1960 cab with Greenbacks (which I think the Suhr kind of does), the Mesa Recto Standard 4x12, and maybe something for the tan pants crowd like an open backed combo?

I don’t know how many of the components in the reactive load are responsible for that aspect.
Fryette and Fractals load boxes have the ability to adjust the curves, but I’m not sure how accurately modelled either of them are.
 
Nice.

I recently got the Fractal LB-2 Reactive Load box, and one reason why was because the graphs out there look like it mimics the real thing pretty well. Pretty similar to the Suhr, but the bass is at a slightly lower frequency.
 
Nice.

I recently got the Fractal LB-2 Reactive Load box, and one reason why was because the graphs out there look like it mimics the real thing pretty well. Pretty similar to the Suhr, but the bass is at a slightly lower frequency.
The Fryette is great, I love my powerstation, I noticed that the curves are a little different at different impedances:

2108B8D9-11AB-4CB7-8B46-5C4C25E1E723.png
D7AE7406-93A5-4655-A179-ABE193BFC86B.png


so it looks like lower impedances have a little more of a resonant bass (boost and cut). I really like being able to adjust the load shape too, really handy feature.
 
A few more curves from different cabs and load boxes:

This one is a few different cabs (V30's and G12m25's). Slight different constructions to them and I guess speaker tolerances vary a bit
4x12 Cabs.jpg
Greenback Cabs.jpg
Mesa Cabs.jpg
1960B V30 Cabs.jpg
Suhr vs Greenbacks.jpg
Load Boxes vs Average.jpg

and this one is the various curves from a Fryette Power Station at 8 and 16 ohms (compared to the average of the cabs measured here:

Fryette vs Average.jpg
 

Attachments

  • 412 Cab Comparison.jpg
    412 Cab Comparison.jpg
    530.7 KB · Views: 180
I asked about the chain and the measurement method. It is not entirely clear to me how you measured the 'impedance curve' and at which points of the chain, or what you measured exactly. As a comparison of individual devices, it's quite fine, but it says almost nothing about the particular load itself, nor about the absolute values of the impedance curve. I also see a lot of dependence on the amplifier used. Loads may behave differently on another one. For example, frequency attenuation at high frequencies in your (blue) graphs is not caused by the load, but by the amplifier. No offense really, you put in a lot of effort, but a measurement methodology is unclear at least to me.

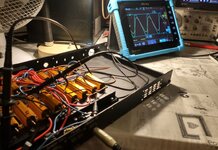
Out of curiosity I made an impedance plot for the St.Rock React:IR. The classic method. Generator, resistor + load. Checking voltages with an oscilloscope at the input and at the load. Measured impedance curve is almost identical to your React:IR measurement at the 100Hz peak, but continues differently after the drop.

Screenshot 2022-09-04 01.44.06.png

rIMG_20220903_221805170.jpg
 
I asked about the chain and the measurement method. It is not entirely clear to me how you measured the 'impedance curve' and at which points of the chain, or what you measured exactly. As a comparison of individual devices, it's quite fine, but it says almost nothing about the particular load itself, nor about the absolute values of the impedance curve. I also see a lot of dependence on the amplifier used. Loads may behave differently on another one. For example, frequency attenuation at high frequencies in your (blue) graphs is not caused by the load, but by the amplifier. No offense really, you put in a lot of effort, but a measurement methodology is unclear at least to me.

Out of curiosity I made an impedance plot for the St.Rock React:IR. The classic method. Generator, resistor + load. Checking voltages with an oscilloscope at the input and at the load. Measured impedance curve is almost identical to your React:IR measurement at the 100Hz peak, but continues differently after the drop.

Oh my apologies - I thought the question was “how would you measure impedance of a cab?” so I posted a link that shows how.

My graphs are showing the effect of various loads on the power amp, rather than the actual curve of the loads. Power amps used were a Dual Rectifier and Friedman’s power amp’s under load. There are a ton of variables at play - it would have been cool to measure their loads as you’ve done but I’d have to rejig too much gear around in the studio, and I figured these plots that show the effects relative to each other in the context they’re being used in would still be useful. For instance, I was curious what the Rectifiers power amp response was like when using my load boxes vs the Mesa cabs.

It’s definitely totally dependent on the individual amps topology, but that was something I was interested in - partly the impedance curve, but also how much effect it has on certain amps.
 
A few more curves from different cabs and load boxes:

This one is a few different cabs (V30's and G12m25's). Slight different constructions to them and I guess speaker tolerances vary a bitView attachment 133924View attachment 133909View attachment 133912View attachment 133915View attachment 133918View attachment 133921
and this one is the various curves from a Fryette Power Station at 8 and 16 ohms (compared to the average of the cabs measured here:

View attachment 133927

@easstudios
Hi,
I also have the Fryette Power Station.
Have you made test of the impedance curve with the frytte switch on Flat Flat? And the combinations Brite Flat, Flat Warm?

I ask you because with high volume amps, the sound seems more normal with one or both switches on flat.
I know that switches on flat represent a resistive load even if the Fryette continues to see the load of the cab.

If you haven't done these tests, could you do them? I am too curious to see what is the impedance curve with the switches on flat.
Thank you!
You actually caught me on a good day - I'm just making IR's of a 1960A with 1984 T75's so it was easy for me to check this. The flat curve looks nothing like a cab impedance curve, you lose that resonant low bump as well as the presence peak. You may still like the sound of it though.

Fryette.png


BTW this is a different amp and settings to the previous tests so they are only relevant to this particular test. In this example Suhr had the closest low end, React IR was somewhere betweem (not quite as resonant) but overall React IR was pretty tight to the curve (Suhr went a bit brighter from 2k and above).
 
You actually caught me on a good day - I'm just making IR's of a 1960A with 1984 T75's so it was easy for me to check this. The flat curve looks nothing like a cab impedance curve, you lose that resonant low bump as well as the presence peak. You may still like the sound of it though.

View attachment 152014

BTW this is a different amp and settings to the previous tests so they are only relevant to this particular test. In this example Suhr had the closest low end, React IR was somewhere betweem (not quite as resonant) but overall React IR was pretty tight to the curve (Suhr went a bit brighter from 2k and above).
Excited to hear you’re making those IR’s! I have 75’s from about the same period in an oversized 2x12 and I love them (well, ONE of them in particular). There are no IR’s out there of these speakers worth a damn.

I usually end up recording that best sounding speaker with a single sm57 off axis, angled kind of across the dust cap pointing towards the cone. There’s a sweet spot where I get a good balance of the sound the speaker gives out that’s more like what I like about hearing it in the room. They’re very finicky speakers to mic up IMO. Sennheiser e906/609 is good on them too but it’s a particular sound.
 
Last edited:
This is really some interesting stuff. Thanks for taking the time to post!!!
 
Back
Top